The Business Models Investors Prefer

MIT Sloan Management Review has an interesting breakdown of business models in the article The Business Models Investors Prefer:

  • Creators, which sell ownership of products they have created by transforming or assembling raw materials or components. Ford, 3M and Intel are examples of this type of company;
  • Distributors such as Wal-Mart or Amazon.com’s retail business, which sell ownership of products they bought but did not substantially change, except by transporting, repackaging or marketing;
  • Landlords, which sell only the right to use assets for a specified period of time; Marriott, Hertz, Accenture and Citigroup are examples of the landlord model. We included in this category companies that employ licenses or subscriptions to sell limited rights to use their intellectual property (IP) assets — companies such as Microsoft and The New York Times;
  • Brokers, which receive a fee for matching buyers and sellers without ever taking ownership or custody of the product; examples include Charles Schwab, eBay and realtors.

There are four types of assets as well:

  • Financial assets, which include cash as well as securities like stocks, bonds and insurance policies that give their owners rights to potential future cash flows;
  • Physical assets, which include durable items such as computers, as well as nondurable items such as food;
  • Intangible assets, which include intellectual property such as patents and copyrights, as well as other intangible assets like knowledge, goodwill and brand value;
  • Human assets, which include people’s time and effort. People of course cannot be legally bought and sold, but their time and knowledge can be “rented out” for a fee

The overall conclusion (in my opinion less important and somewhat questionable) is:

“In research we conducted at the MIT Sloan School of Management, we found that the stock market consistently values certain types of business models more highly than others. Specifically, we found that in recent years, investors have favored business models focusing on licensing intellectual property (such as Walt Disney’s business model) and a certain kind of highly innovative manufacturing (such as Apple’s).”


5 Myths of Innovation

Prof. Birkinshaw has a must read article for all innovation managers in the MIT Sloan Management Review: The 5 Myths of Innovation.  Here are my learnings from it:

  1. Innovation is NOT about the Eureka moment.  Innovation is 5% inspiration and 95% perspiration.  Companies are good at generating ideas, but it is in the detailed development and getting the innovation ready for market is where most failures are identified (the valley of death). The research shows that many companies are good at generating ideas (or at least ideas that sound good), but the performance drops through successive steps of development.

    Most innovation efforts fail not because of a lack of bright ideas, but because of a lack of careful and thoughtful follow-up. Smart companies know where the weakest links in their entire innovation value chain are, and they invest time in correcting those weaknesses rather than further reinforcing their strengths.

    The eureka moment is the driving force behind ideation workshops. I have myself conducted several and have been amazed at the lack of results. Many ideas sound good on the surface but digging into them is expensive. Also, it is very hard to find budget to explore ideas beyond the ideation workshop.

  2. Innovation does not come from social interaction: There has been many suggestions of using social networks (here and here) and online forums to gather innovation ideas and nurture innovation (Tata’s learn to innovate).  However, the success of tehse forums is not guaranteed. As we have seen in the past, active engagement from the managers/executives is key to success of any online forum.  Here are some more thoughts:

    So what should you do to avoid these problems? The most important point is to understand the types of interaction that occur in online forums, so that you use them in the right way. If you are looking for creative, never-heard-before ideas, and if you want people to take responsibility for building on one another’s ideas, then a face-to-face workshop is your best bet. But if you are looking for a specific answer to a question, or if you want to generate a wide variety of views about some existing ideas, then an online forum can be highly efficient. (See “Questions That Work — and Don’t — in Online Innovation Forums” for examples.)

  3. Open Innovation is not critical: Borderless or open innovation where companies access innovation from the outside has been much revered as the next big wave (See hotbeds of innovation, quirky innovation, etc).  However, nurturing innovation from the outside is an order of magnitude more complex than internal ideas.  R&D teams are often weary of outsiders. Organizations often have a problem with not-invented-here.  Finally, outsiders often speak a different language from internal teams, which makes it difficult to internalize their innovation.  Add to it complexity of IP licensing and costs of evaluating thousands of ideas that you might receive from the outside, and it becomes unmanageable.  The key is to access innovation from the outside when the problem can be very narrowly and precisely defined and there is not much overlap between external/internal teams.

    External innovation forums have access to a broad range of expertise that makes them effective for solving narrow technological problems; internal innovation forums have less breadth but more understanding of context. Smart companies use their external and internal experts for very different types of problems.

  4. Financial Incentives are not the best way to drive to innovation:  As we have discussed many times (the problem with financial incentives, impact of incentive bonus plans, etc), financial / monetary incentive are probably not the best approach to driving innovation.  Prof. Birkinshaw has the following to say:

    Rewarding people for their innovation efforts misses the point. The process of innovating — of taking the initiative to come up with new solutions — is its own reward. Smart companies emphasize the social and personal drivers of discretionary effort, rather than the material drivers.

  5. Top-down innovation is as important as bottom up: There is a misconception that all innovations start from disruptive technologies and key R&D.  However, even when the ideas come from R&D, they need to be actively funded and managed to succeed.  Also, it takes a lot of discipline and cultural change to get disruptive innovation to market. 

    Bottom-up innovation efforts benefit from high levels of employee engagement; top-down innovation efforts benefit from direct alignment with the company’s goals. Smart companies use both approaches, and are adept at helping bottom-up innovation projects get the sponsorship they need to survive.


Why Stock Options Lead to More Risk Taking

We have recently discussed some interesting research on the use of incentives to drive R&D performance.  We learned that incentive bonus plans tend to make executives modify goals to ensure incentives are obtained. We also learned that stock options are not actually seen as performance drivers but gifts from the company.  Financial incentives themselves have been seen as not very effective towards driving true performance.  Now there is one more piece of the puzzle from Knowledge@Wharton (The Making of a Daredevil CEO: Why Stock Options Lead to More Risk Taking):

The research is laid out in a new paper, ‘CEO Compensation and Corporate Risk Taking: Evidence from a Natural Experiment,’ by Gormley, David Matsa, a professor at Northwestern University’s Kellogg School of Management, and Todd Milbourn, a professor at Olin Business School at Washington University in St. Louis. ‘Options do have an effect on risk taking,’ Gormley says. ‘That is something that should be factored into compensation structure by boards of directors.’

As we have discussed earlier, stock options are increasingly used as part of the compensation package:

Stock options are a critical element of CEO compensation — making up one quarter of total pay for executives these days. But what does that mean for the risk profiles of the companies those CEOs lead?

The problem is that stock options only work in one way – towards the upside.  If the stock price falls below the option value, they are worth zero (not negative).

At the heart of that question are two opposing forces: There is a risk-tempering aspect to options, because when those options are “in the money” — meaning the exercise price is less than the current market price — the value of those options moves in line with the stock price. That tends to dampen risk taking because CEOs want to preserve the value of those options.
At the same time, however, the downside of risk taking is limited because once the options are worth zero, they do not decline further in value if the stock price falls. And that limited downside increases the tendency to take on risk.

In summary use straight equity instead of options to moderate risk taking :

Research has shown that senior executives at financial firms have a large part of their compensation in the form of restricted stock — securities that, like straight equity, tend to reduce risk taking. But at the lower levels of those firms — areas like sales and trading — a large chunk of compensation is tied to bonus pools. Like options, those bonus pools have a large upside and limited downside. After all, once the pool is worth zero, managers have little to lose. That sort of compensation does, in fact, encourage risk taking, Gormley notes.

I am getting more and more convinced that the best approach is to measure risk taking and reward it using concrete metrics instead of using indirect tools such as options…


Customer value to drive urgency in change management

Research & Technology Executive Council has a couple of good pointers for change management in Taking Process Excellence to the Next Level: “

To push change across the organization, leaders must create and communicate a compelling case for change and orchestrate the deep commitment of people at various levels and in various departments.

 We have discussed the sense of urgency and commitment and pointed out several effective approaches to communicate them. This article adds a new twist: Using customer value proposition to communicate the value and benefit of the change.

A compelling case for change is typically built on either an imminent threat or a perceived major opportunity, and the best test of this is whether people step forward as willing followers and whether they act with urgency. This is where viewing operations from the customer’s point of view becomes important. In building a compelling case for change, highlighting the gap between current and desired performance for customers can be a powerful way to touch people’s emotions. In this respect, the factors that motivate employees to act are often different from those that resonate with the members of the senior leadership team. Factors such as growth, profit, and competitive advantage are likely to capture the attention of executives, while other factors such as customer satisfaction and pride in their work may do more to engage employees in the case for change.”


Role of Government Regulation in Driving Innovation: Wind Power in China

The widely held belief is that regulation and government protection does not actually drive innovation. Clayton Christensen in China’s Growth Will Force an Innovation Competition with the West points out that India’s regulations for 30 years actually produced no benefits for the society.  Here is another viewpoint and a lot of interesting data from Knowledge@Wharton (Wind Power in China: Lots of Turbines, Little Bluster?):

China has more than 80 wind turbine manufacturers, four of which are among the top 10 globally by market share. By the end of last year, it had 45 gigawatts (GW) of installed wind power, up 73% from 26 GW in 2009, compared with 40 GW in the U.S., according to the Brussels-based Global Wind Energy Council. And China’s government intends to raise total wind power capacity even further, to 100 GW by 2015 and 200 GW by 2020. Louis Schwartz, a U.S. lawyer and specialist in Chinese energy, says China’s officials have spoken off the record of targets that are even higher, reaching 150 GW by 2015 and 250 GW by 2020.“

The fact is that the foreigners have been pretty much shutout of the Chinese markets (Vesta has a meager 4.6% market share in China).

Before China’s wind energy market really took off around five years ago, there were roughly 10 foreign and local wind turbine manufacturers in China, according to Jens Tommerup, president of the China arm of Denmark’s Vestas, Danish firm with US$9.8 billion (RMB 63.4 billion) of annual revenue, which commands a world market share of nearly 15%.”At that point, non-Chinese manufacturers had the majority of the market,” he says. But last year, while the number of non-Chinese manufacturers remained largely the same, the number of Chinese manufacturers increased to more than 70. The foreign share of China’s wind business plummeted to 10.5% from 75% in 2005. Amid the state of flux, top foreign turbine makers are by no means suffering, even if their overall market share has declined.

The Chinese, on the other hand, have no foreign presence – probably because they are not mature and cannot compete technologically

Yet China’s turbine makers have a meager presence in world markets and nearly all their growth has been at home. In 2010, only one Chinese company among the country’s top four, Goldwind, exported wind turbines — 4.5 megawatts (MW) to Cuba, which accounted for 0.12% of Goldwind’s total new installations of 3,739.5 MW last year.

Dependence on domestic and often immature technology has caused problems:

The issue hit home after a massive disruption in February at the Jiuquan wind farm in Gansu province in northwest China. Regulators at SERC said it was the most severe accident for wind power grids in recent years. Reporters at the financial newspaper China Business News learned that most of Jiuquan farm’s wind power units did not have what’s known in the industry as “low voltage ride-through capability.” Such technology gives a power grid time to adjust itself in the event of temporary faults and maintain uninterrupted grid connection.

However, the fact is that now that the Chinese firms have had time to mature, they are going to start competing in the global market place.

Goldwind is targeting markets in the U.S., Europe, Australia and Africa and expects its overseas business to account for between 20% and 30% of sales within five years.

May be that is too ambitious:

That’s a tall order. It currently only has 9.5% of the global market share. Along with China’s Sinovel at 11.1% and Dongfang at 6.7%, other leaders included GE Wind of the U.S. at 9.6%; Enercon of Germany at 7.2%; and Suzlon of India at 6.9%, according to a report titled, “International Wind Energy Development Market 2010,” by Denmark-based BTM Consult.

But the fact is that none of this would have been remotely possible if China did not regulate the market to allow its own industry to become strong. May be there is a place for regulation – as long as the protection is for a short time, targeted and with significant competition. We know that rivalry and scarcity are drivers of innovation – so as long as money is not given out freely, it might encourage innovation and give national companies a chance to become strong. Countries could consider outsourcing innovation when necessary, not just buy the whole system from a foreign provider.  May be the reason why Indian regulation did not work was because they did not have a large number of companies competing for contracts.  In fact, they probably regulated the number of companies…


Use of IT to support R&D management

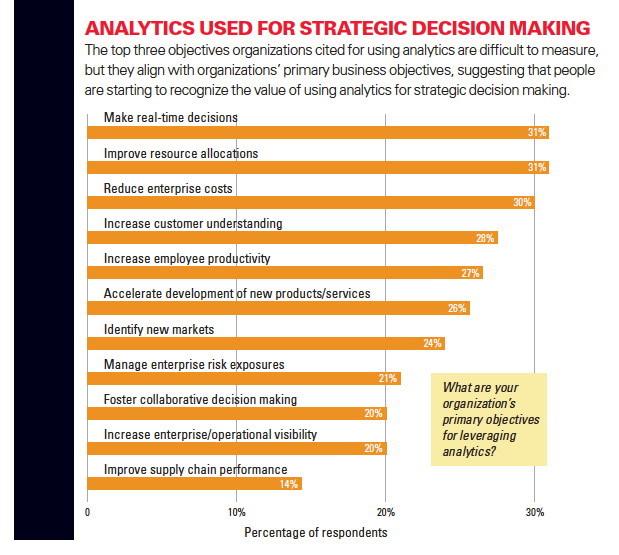
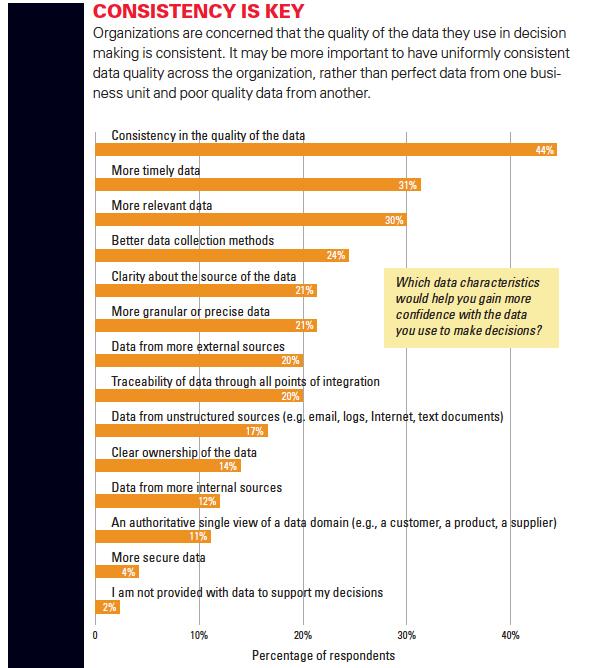
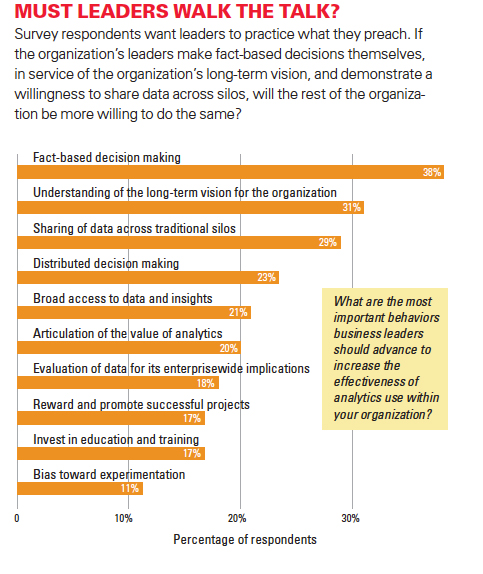
MIT Slaon Review has results of a survey about the use of data analytics in corporations with quite a bit of useful information.

Our inquiry into how organizations are turning analytics into competitive advantage comprised conducting a survey of more than 4,000 executives, managers and analysts from around the world and from a wide range of industries. The results of our second annual survey are now in and we’ve begun analyzing the data.

Here are some key take home messages for R&D managers.

  1. Data analytics is mainly used to support decision making and resource allocation.  (Pretty obvious)
  2. The key problem in use of data analytics is integrating data from a wide variety of sources.  This is a key problem in R&D management as different the disciplines involved in R&D all use completely different jargons and tools.  The same data is called differently is engineering, project management, marketing or resource allocation.
  3. Another key hurdle is in the consistency of data. When so many different disciplines and tools are involved, it is rare that they all have data available at the same maturity / detail. Many times, organizations with mature data get punished because bad performance is noticeable, while those that do not have data get to misbehave without any problems. This actually devolves organizations to hide data!
  4. Once the information becomes available, executives need to have consistent decision making. This hard because if pet projects are shown to not add value, executives will have to kill them just like any other project. I have seen many a decision making process fail because the leaders were not willing to make hard decisions. Once information becomes available, the leaders will have to walk the talk!

INSEAD Global Innovation Index

INSEAD just announced its 2011 Global Innovation Index (Or an interview here).  Here are top 10:

  1. Switzerland
  2. Sweden
  3. Singapore
  4. Hong Kong (SAR)
  5. Finland
  6. Denmark
  7. United States
  8. Canada
  9. Netherlands
  10. United Kingdom

Here is how this index is computed:

The Global Innovation Index is computed as an average of the scores across inputs pillars (describing the enabling environment for innovation) and output pillars (measuring actual achievements in innovation). Five pillars constitute the Innovation Input Sub-Index: ‘Institutions,’ ‘Human capital and research,’ ‘Infrastructure’, ‘Market sophistication’ and ‘Business sophistication’. The Innovation Output Sub-Index is composed of two pillars: ‘Scientific outputs’ and ‘Creative outputs’. The Innovation Efficiency Index, calculated as the ratio of the two Sub-Indices, examines how economies leverage their enabling environments to stimulate innovation results.

May be US does indeed need to invest more in innovation, but US already has the largest R&D budget in the world.  May be we need to think of something new?

Dr. Naushad Forbes, Chairman of the CII Innovation Council 2011-12 and Director of Forbes Marshall commented: ‘Today the whole world is talking about innovation in all forms starting from industry to government to society. After the recent economic slowdown the focus has shifted clearly towards the developing regions not only in terms of a booming potential market but also a hot spot for frugal innovations. Measuring this shift is important to know how we are doing, the GII is a starting point to do that and unquestionably in the right direction.’

Here is the NSF Innovation Survey if you want more…


Global race on to match U.S. drone capabilities

A quick post for today.  The article Global race on to match U.S. drone capabilities in The Washington Post has quite a bit of interesting data:

More than 50 countries have purchased surveillance drones, and many have started in-country development programs for armed versions because no nation is currently exporting weaponized drones beyond a handful of sales between the United States and its closest allies.

And here is some evidence:

“In an animated video and map, the thin, sleek drone locates what appears to be a U.S. aircraft carrier group near an island with a striking resemblance to Taiwan and sends targeting information back to shore, triggering a devastating barrage of cruise missiles toward the formation of ships.”

Drones or Unmanned Aerial Vehicles (UAV) are popular because of low cost and low risks:

Military planners worldwide now see drones as relatively cheap weapons and highly effective reconnaissance tools. Hand-launched ones used by ground troops can cost in the tens of thousands of dollars. Near the top of the line, the Predator B, or MQ9-Reaper, manufactured by General Atomics Aeronautical Systems, costs about $10.5 million. By comparison, a single F-22 fighter jet costs about $150 million.

Efforts are underway to extend UAV beyond land:

In recent conflicts, the United States has primarily used land-based drones, but it is developing an aircraft carrier-based version to deploy in the Pacific. Defense analysts say the new drone is partly intended to counter the long-range “carrier killer” missile China is developing.

Here is how arms races start:

China’s rapid development has pushed its neighbors into action. After a diplomatic clash with China last fall over disputed territories in the South China Sea, Japan announced that it planned to send military officials to the United States to study how it operates and maintains its Global Hawk high-altitude surveillance drones. In South Korea, lawmakers this year accused China of hacking into military computers to learn about the country’s plans to acquire Global Hawk, which could peer into not only North Korea but also parts of China and other neighboring countries.

Here is an example of arms proliferation (through resale of technology):

In 2009, the United States also objected to an Israeli sale of sophisticated drones to Russia, according to diplomatic cables released by the anti-secrecy group WikiLeaks. A smaller co-production deal was later brokered with the Russians, who bristled when Georgia deployed Israeli surveillance drones against its forces during the 2008 war between the two countries.

Here is another path for proliferation: From low cost producers / trailing players to defray costs of accelerated development:

“The United States doesn’t export many attack drones, so we’re taking advantage of that hole in the market,” said Zhang Qiaoliang, a representative of the Chengdu Aircraft Design and Research Institute, which manufactures many of the People’s Liberation Army’s most advanced military aircraft. “The main reason is the amazing demand in the market for drones after 9/11.”

And as a response, US also has to start exporting its technologies:

Vice Adm. William E. Landay III, director of the Defense Security Cooperation Agency overseeing foreign military sales, said at a Pentagon briefing last month that his agency is working on pre-approved lists of countries that would qualify to purchase drones with certain capabilities. “If industry understands where they might have an opportunity to sell, and where they won’t, that’s useful for them,” Landay said.


China’s Growth Will Force an Innovation Competition with the West

One key point for R&D managers in Knowledge@Wharton article  Clayton Christensen: ‘China’s Growth Will Force an Innovation Competition with the West’:

But because China is growing so fast, they are now starting to feel the impact of their policy on population control. Wage rates are going up at a very fast rate… I don’t know who else can join them, but this will force China to not just knock off designs from the West. They’ll have to compete on innovation as well, because other countries can take the low end.”

I think this can be a very important driver of long-term R&D strategy.  We have discussed how  necessity is the mother of innovation. When companies compete in low cost markets, they have generate new innovations – which in turn improves their competitive position in the high value market (what is normally called frugal engineering or reverse innovation).  However, this article points out the next frontier – challenge from the BRIC countries in high cost  market.  Are we ready for that?


2011 Global R&D Funding Forecast

Here is link to the 2011 Global R&D Funding Forecast: from the R&D Magazine: “

Global Spending Following cuts in total R&D spending by most advanced economies during the global recession in 2008 to 2009, R&D spending growth resumed, albeit at reduced levels, in 2010 and is again forecast for 2011. Rapid growth in R&D spending in emerging Asian nations only slowed slightly during the recession and is forecast to continue growth that is several times that of the advanced economies.

US has a third of the global R&D spending, even though others are growing much faster. Here are some takeaways:

  1. In addition to outsourcing R&D, many organizations are building new R&D facilities in offshore locations.
  2. R&D Collaboration is increasing between developed and developing nations, with all parties gaining from it.
  3. R&D gap between developed and developing countries are narrowing as measured by patent filings.  Even though developed nations continue to file for new patents, developing nations are fast accelerating their rate of patenting.
  4. And some good news – academic innovation and R&D is accelerating.  May be because many strong students went back to academia when they could not find jobs in the great recession…
A lot of interesting data.